
GIS and geospatial intelligence
Spatial analysis to permit, site, acquire and monitor: environmental constraints, land use and land cover, and change over time, in maps that support a decision.
- Data
- Relief · hydrography · land use and land cover · satellite imagery
- Products
- Constraints map · area schedule · time series
- Reference
- SIRGAS 2000 · UTM
The problem
The constraint that redraws the project was almost always on the map already.
Protected riparian areas, slope, native vegetation, conservation units, caves: most of the constraints that change a project can be read before design, with public data and method. Read afterward, they become engineering rework and agency requirements.
The same holds for time. What changed on the site, when and by how much are questions satellite imagery answers with a date, and with the same yardstick for every year.
Who it is for
- Anyone assessing a site, a land parcel or an expansion area
- Anyone studying a route or the location of structures
- Anyone who has to support a permit application with technical maps
- Anyone monitoring land under commitment: recovery, offsets, authorized clearing
Demonstration
Urban fringe of Nova Serrana, Minas Gerais: constraints and growth, 1985 to 2024.
A complete land-use reading made with open data only. It does not correspond to a project, a client or a property: the area was chosen to show the method.

Layers
- Sentinel-2 image
- Shaded relief
- Contour lines
- Drainage derived from relief
- 30 m strip
- Slope of 30% or more
- Native vegetation (2024)
- Urbanized area
Demonstration · public data
Step 1 of 8
The territory
The town of Nova Serrana (Minas Gerais) and its rural surroundings, as the satellite saw them on September 27, 2026. Every reading starts here: what is on the ground, with a date.
- Study area
- 11,094 ha · 12.6 × 8.8 km
- Image
- Sentinel-2 L2A, 10 m resolution
- Rendering
- True color converted to the brand tones
Step 2 of 8
The geospatial base
Every layer is brought onto a single grid, in SIRGAS 2000 / UTM 23S. From here on each dataset sits in the same place, and area and distance are measured in meters.
- Reference system
- SIRGAS 2000 / UTM 23S (EPSG:31983)
- Grid
- Lines every 2 km
- Northwest corner
- E 495 820 m · N 7 806 770 m
Step 3 of 8
Relief
The digital elevation model enters the analysis. Contour lines form from the lowest elevation to the highest, every 20 m.
- Elevation
- 662 to 927 m
- Contour lines
- Every 20 m; index contours every 100 m
- Source
- Copernicus DEM GLO-30, 30 m resolution
The hillshade uses 3-times vertical exaggeration: a reading aid, not the geometry of the terrain.
Step 4 of 8
Drainage
The drainage network is extracted from the relief itself: where water runs once the contributing area exceeds 40 ha. The line follows the flow, from the headwaters to the outlet.
- Length
- 105.5 km in 136 reaches
- Criterion
- Contributing area of 40 ha or more
- Nature of the data
- Network inferred from relief, not the official hydrography
Step 5 of 8
Constraints
Three readings on the same grid: the 30 m strip along the drainage, hillsides with a slope of 30% or more, and the native vegetation mapped in 2024.
- 30 m strip
- 646 ha
- Slope of 30% or more
- 254 ha
- Native vegetation
- 2,425 ha
The strip applies Article 4, I, “a”, of Law 12,651/2012 to an inferred drainage: it is not a legal delineation of permanent preservation areas.
Step 6 of 8
What changed
The annual land use and land cover classification shows the urbanized area advancing, year by year, over what was pasture and forest formation in 1985.
- Urbanized area
- 230 ha in 1985; 2,557 ha in 2024
- What the new urban area used to be
- 66% pasture; 26% forest formation
- Source
- MapBiomas, Collection 10, 30 m resolution
This is a land cover classification, not a spectral index.
Step 7 of 8
Synthesis
The layers are overlaid. What lies outside the urbanized area with no mapped constraint is where the study of alternatives begins; the intersections show where to look first.
- No mapped constraint, outside the urbanized area
- 5,725 ha (52% of the area)
- 30 m strip already urbanized
- 134 ha
- 30 m strip with native vegetation
- 225 ha
A plain overlay of layers, with no weighting of criteria.
Step 8 of 8
The map
The product is a technical map with legend, scale, reference system and sources, delivered with the table of areas. It is a preliminary reading: on a contracted job it is redone with the official state datasets, the property records and a field check.
- Products
- Constraints map · table of areas · historical series
- Reading scale
- Regional, with 10 to 30 m datasets
Land-use intelligence for engineering decisions.
- Technical product
- Constraints map and multi-temporal land use and land cover analysis
- Nature
- Preliminary land-use reading, at regional scale
- Application
- Screening of areas for siting or expansion; context for permitting and due diligence
- Method and data
- Single grid in SIRGAS 2000 / UTM 23S. Relief: Copernicus DEM GLO-30. Land use and land cover: MapBiomas, Collection 10, 1985–2024. Imagery: Sentinel-2 L2A of September 27, 2026. Drainage derived from relief, with a minimum contributing area of 40 ha.
- Result delivered
- Area schedule by constraint, four maps and a yearly series of urbanized area
- Origin
- Produced by H·MARIZ with its own reproducible routine
Study area: 11,094 ha (12.6 × 8.8 km) around the town center.

- Urbanized area (2024)
- Native vegetation (2024)
- Slope of 30% or more
- 30 m strip along watercourses
Reading the constraints
| Study area | 11,094 ha |
|---|---|
| 30 m strip along 106 km of drainage | 646 ha6% of the area |
| Slope of 30% or more | 254 ha2% of the area |
| Native vegetation | 2,425 ha22% of the area |
| Urbanized area | 2,557 ha23% of the area |
| Outside the urbanized area and with no mapped constraint | 5,725 ha52% of the area |
The categories overlap, so they add up to more than the total. The 30 m strip is the one set by Article 4, I, “a” of Brazil's Forest Code (Law 12,651/2012) for watercourses less than 10 m wide, applied here to drainage inferred from relief: it is not a legal delineation of protected riparian areas. The 30% threshold comes from Article 3, sole paragraph, III of Law 6,766/1979: on such land, urban subdivision is allowed only under specific requirements.
Urban growth, 1985–2024
Urbanized area went from 230 ha in 1985 to 2,557 ha in 2024: about 11 times the initial area. Of what was added, 66% was pasture and 26% was forest formation in 1985.

- Up to 1985
- 1986–1995
- 1996–2005
- 2006–2015
- 2016–2024
Remote sensing and environmental monitoring
The same area, seen by satellite on September 27, 2026. The image shows what is there; the vegetation index measures it.
The same area, on two dates.
Drag the line to compare. Both images go through the same stretch, so the difference comes from the ground, not from the processing.
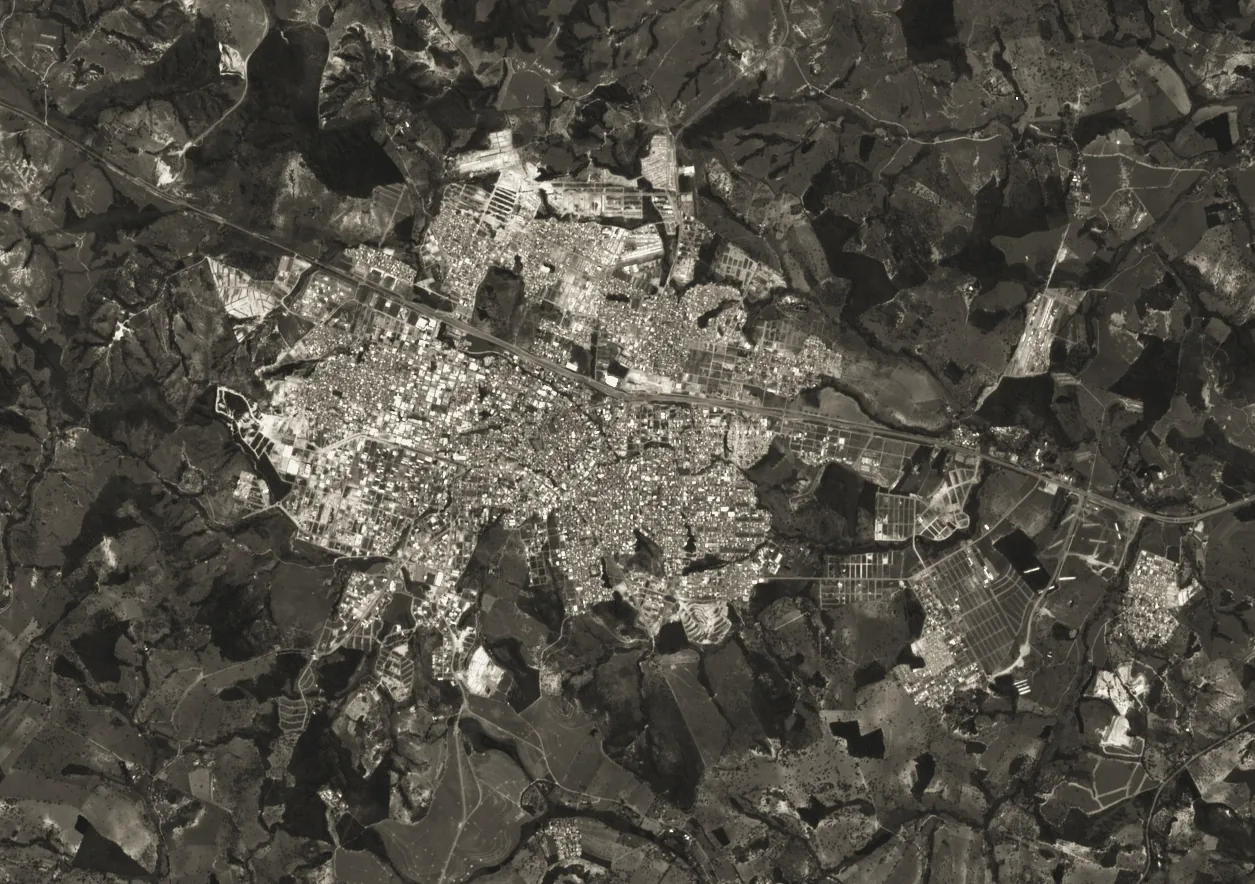
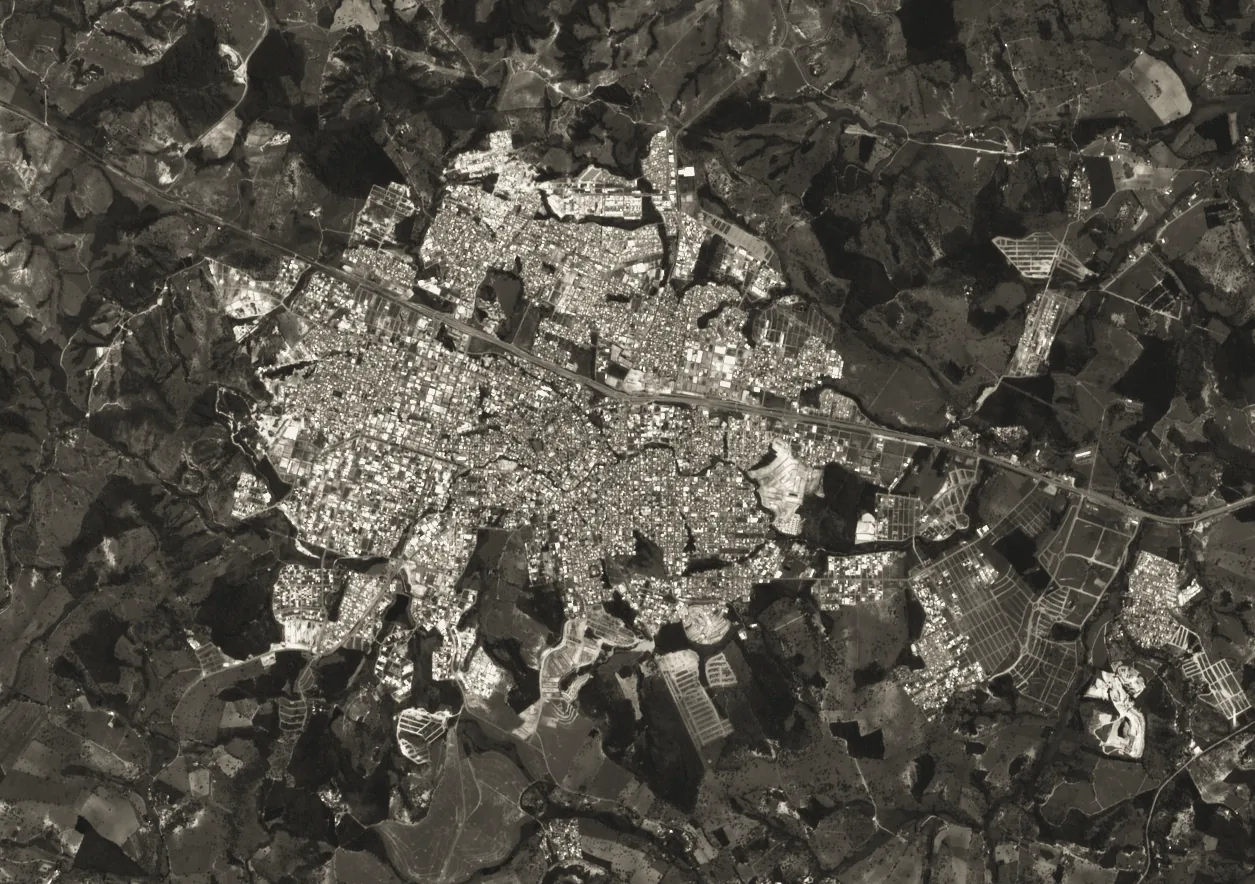
Sentinel-2, true-color composite converted to the brand tones. 10 m resolution.
NDVI computed from the red and near-infrared bands. The darker the tone, the more active the vegetation.
Sentinel-2 L2A, 10 m resolution, dry season on both dates. NDVI is a spectral index computed from the red and near-infrared bands; it is not a land cover classification.
Median NDVI by land cover class: native vegetation 0.82; pasture 0.50; urbanized area 0.17.
- Multi-temporal land use and land cover analysis
- Monitoring of vegetation and of areas under recovery
- Detection of changes on land under commitment
- Spectral indices as dated indicators
- Image interpretation combined with field inspection
Sources
- Land use and land cover: MapBiomas Project – Collection 10 of the Annual Series of Land Use and Land Cover Maps of Brazil, accessed on October 8, 2026 through the link: https://brasil.mapbiomas.org (CC BY 4.0).
- Relief: produced using Copernicus WorldDEM-30 © DLR e.V. 2010–2014 and © Airbus Defence and Space GmbH 2014–2018 provided under COPERNICUS by the European Union and ESA; all rights reserved. The organizations in charge of the Copernicus program incur no liability for any use of these data.
- Imagery: contains modified Copernicus Sentinel data (2026), accessed through the Earth Search catalog (Element 84).
Limits of this reading: data at 10 to 30 m resolution, with no topographic survey, no official hydrographic base and no site visit. In contracted work, the analysis is redone with the official state datasets, the property's documents and field verification.
Tools and datasets in regular use
QGIS and Google Earth Pro; datasets from IBGE, IDE-Sisema and DataGEO; Copernicus elevation models; in-house Python routines for time series and overlays.
Scope and deliverables
Spatial analysis built for a decision.
Every analysis comes with its assumptions, datasets and limits written on the map itself.
Environmental constraints analysis
Protected riparian areas, slope, vegetation, protected areas and other spatial constraints overlaid on the site.
Deliverable
Constraints map and area schedule.
Maps for permitting
Location, areas of influence, land use and interventions, in the format the agency requires.
Deliverable
Technical maps and georeferenced files for the studies.
Siting alternatives and multi-criteria analysis
Comparison of sites or routes against environmental, land tenure and engineering criteria, with explicit weights.
Deliverable
Alternatives matrix and comparative map.
Land tenure and land-use intelligence
Properties, registries and boundaries read together with the constraints; support for selecting offset areas.
Deliverable
Map of the land tenure and environmental status of the area of interest.
Multi-temporal analysis
Land use and land cover as a historical series: what changed, when and by how much.
Deliverable
Maps by period, area series and an interpretation report.
Monitoring by satellite imagery
Vegetation, environmental recovery and changes on monitored land, using spectral indices and visual interpretation.
Deliverable
Periodic report, with dated images and indicators.
How the work is organized
How a spatial analysis is put together.
01
Understand
The business question and the site: what is to be decided, and at what scale.
02
Structure
Datasets, dates and criteria chosen and stated before processing.
03
Deliver
Processing on a single grid, overlay of the layers and checking against the site visit.
04
Manage
Map, area schedule and the limits of the analysis delivered together, ready to update.
Proven experience
Maps that have supported studies and decisions.
- ART · engineer of record
Mapping of protected riparian areas, physical-environment and constraints reports, land-use reports, forest inventories with maps and georeferenced plans, with an ART on record.
- H·MARIZ · 2026
Geospatial reading in a preliminary assessment delivered in 2026: hydrography, protected riparian areas, relief, drainage and sub-catchments derived from an elevation model.
- Executive experience
Structuring and assessing siting, land tenure and environmental alternatives to support decisions on development, expansion, compliance and offsets.
- Demonstration · public data
This page's demonstration: four maps and the figures, generated by an in-house routine from open data.
Experience from 2009 to 2023 belongs to the responsible engineer and is recorded in ARTs (technical responsibility records) filed with CREA-MG; the 2026 work was contracted by H·MARIZ. Clients are not named. The list of ARTs is available on request.
Next
Related portfolio and capabilities.
Related portfolio
Mining
Environmental strategy for mining
From the first study to mine closure: feasibility, permitting, operations, compliance, critical situations and closure.
Request the presentationReal estate development
Environmental strategy for real estate development
Acquisition, design, approval and construction: what comes with the land and how it enters the decision.
Request the presentation
Contact
Is there a site to read before deciding?
Send the location. The first reading shows whether a constraint changes the plan.
Henrique Marizhenrique@hmariz.comWhatsApp (31) 99791-8003Belo Horizonte, Minas Gerais